Unlock Actionable Insights with Simple Chart and Data Set Creation
Create customized data sets and dynamic visualizations in minutes and uncover valuable insights without complex coding.
Simplify Data Exploration with Our Chart and Data Set Builder
Create and customize data sets, charts, and visualizations without writing complex SQL queries or code.
Create Data Sets with Ease
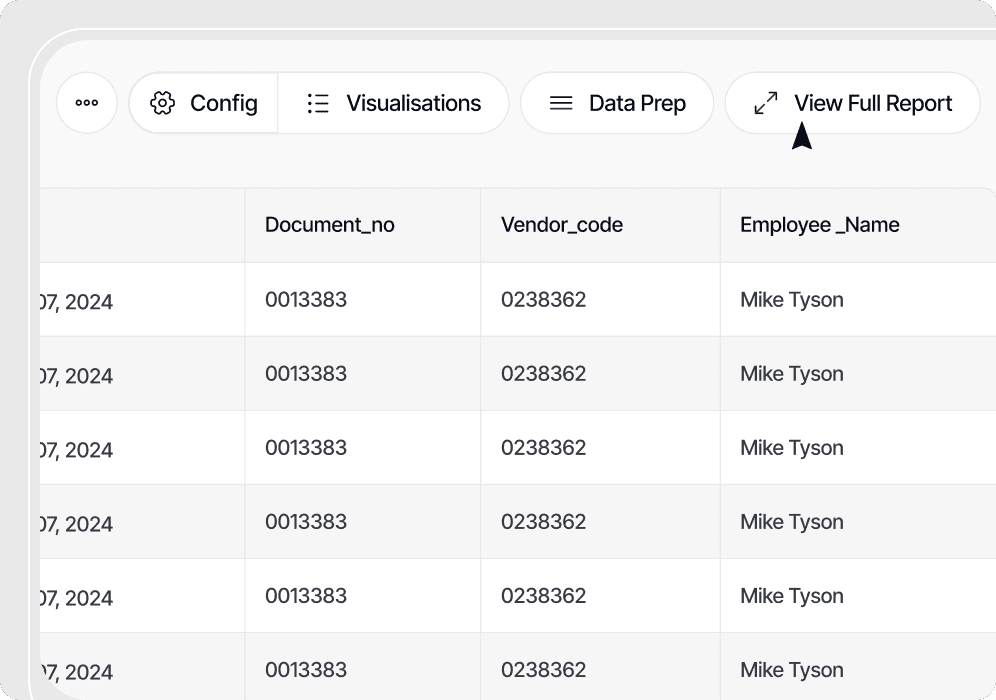
Build insightful reports by selecting fields from your App or semantic layer. Automatically generate SQL code, fetch live data, and preview the top 50 records for quick insights. Customize your data sets and save configurations for future use.
Transform Your Data into Stunning Visuals
Convert data sets into dynamic charts and visualizations using intuitive tools with zero coding expertise required.
Charts Made Simple
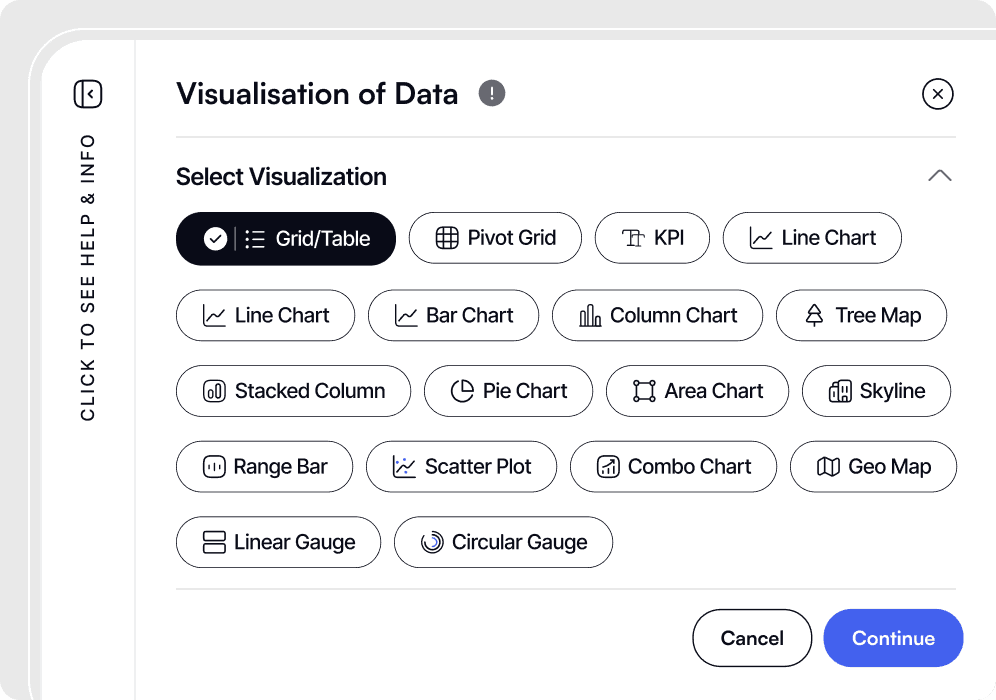
Use our chart builder to create bar, pie, area, line, tree maps, KPIs, gauges, geo maps, and more. The step-by-step chart wizard guides users through the process with zero confusion.
Personalize Visualizations with Ease
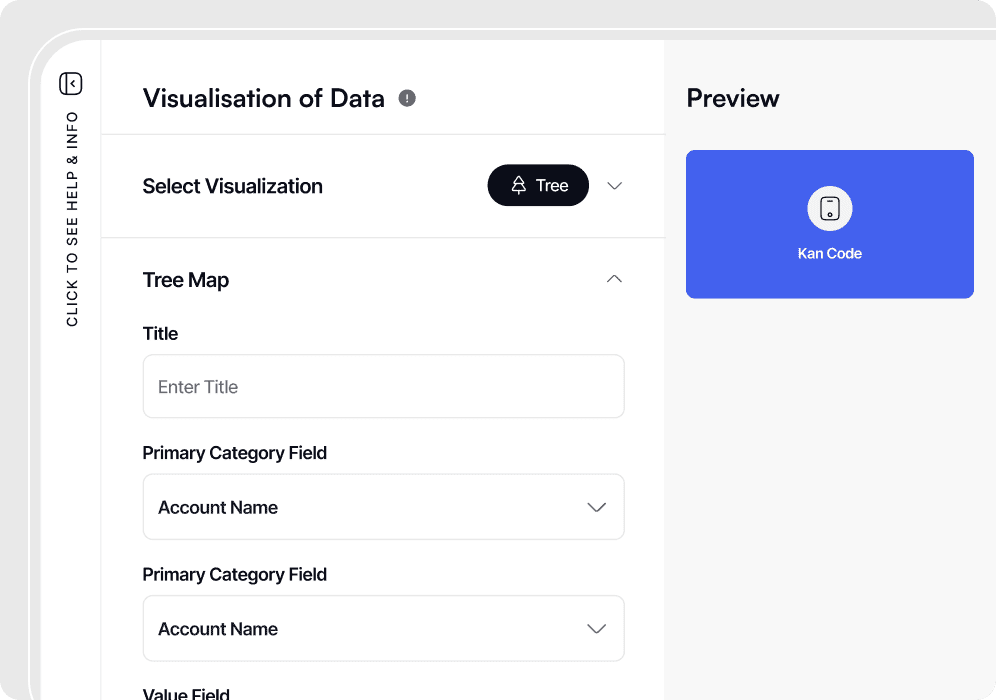
Add personal touches using the chart wizard to customize your visuals. Customize titles, axis labels, legends, label formats, hover reports, drill-down reports, and more to tailor visual representations to your specific needs and preferences.