Make Key Decisions in Minutes with Stunning Data Visualizations.
Boost decision-making with custom visualizations in our interactive dashboard.
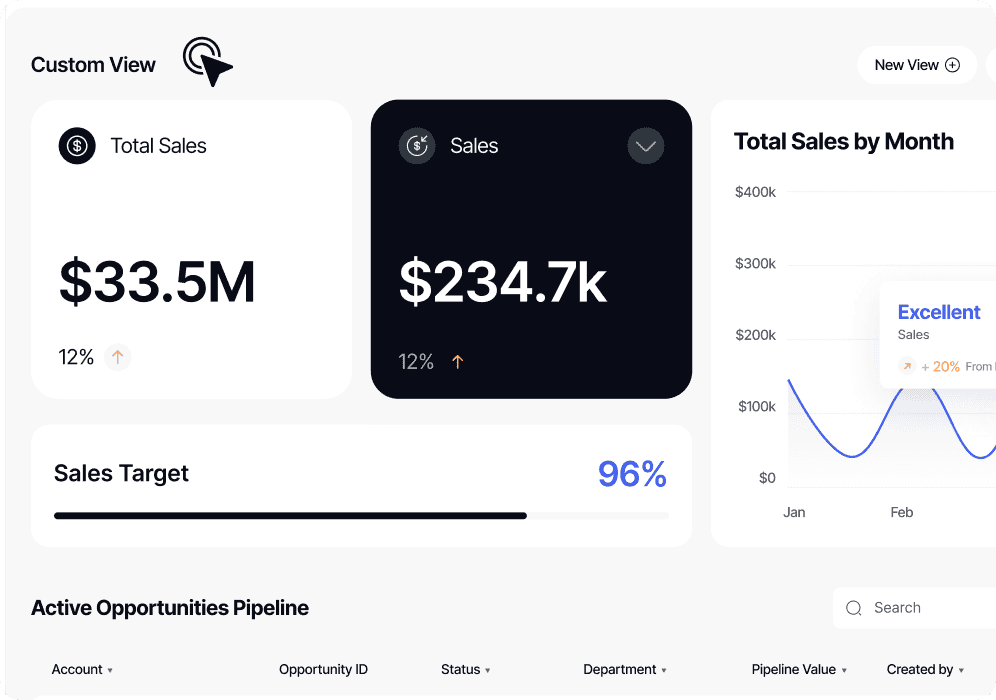
Boost your decision-making with easy-to-understand, customized dashboard visuals.
Custom visuals that prevent decision paralysis and give business users the most relevant data insights.
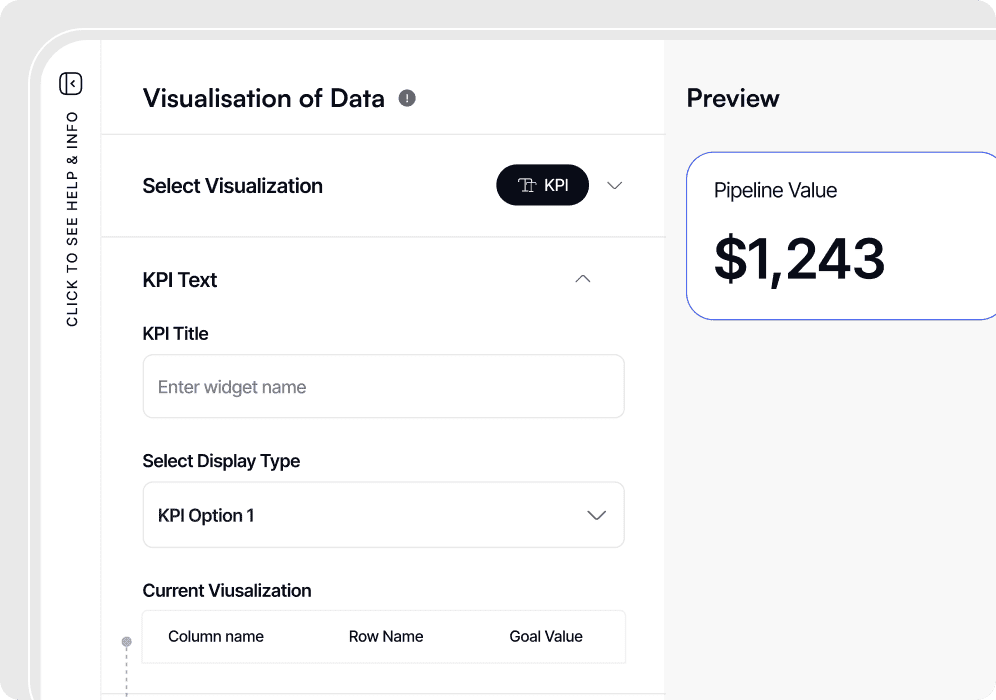
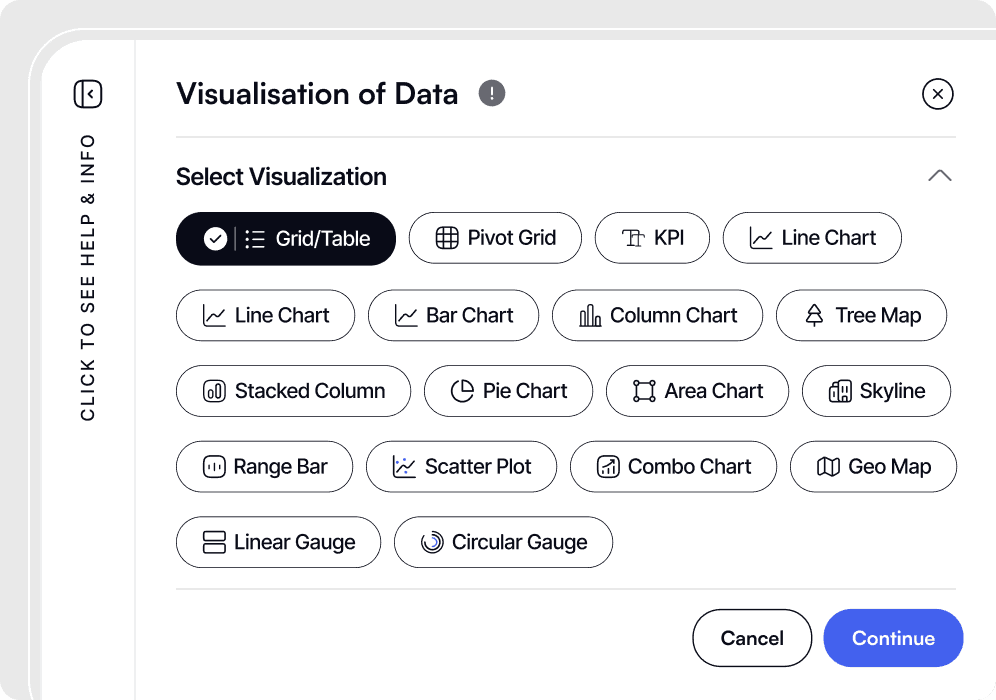
Streamlined Visualization Options Choose from visualization types including data grids, KPIs, and chart types like bar, column, pie, scatter, heatmap, line, area, combination charts, maps and gauges. Use our report builder to create stunning visuals with zero programming or database expertise.
Customization at Your Fingertips Customize titles, legends, label formats, hover boxes, drill downs and more to meet your unique analytical needs.
Empower Users with Personalized Visualization Capabilities
Users can personalize their visualization and display preferences without affecting others.
User-Friendly Visualization Builder No-code visualization builder empowers report builders and view-only dashboard users to modify visualization types in real-time. Allows users to customize visualizations for printing or exporting without affecting shared dashboard settings.
Customer-Driven Development Our team continuously improves the platform based on your feedback. We regularly add new visualizations to cater to ever-changing data analysis needs. Customer-driven development ensures we stay ahead of industry trends.
Make Informed Decisions with Purposeful Visualizations
Empower users to create meaningful visualizations that lead to actionable insights.
Simple Data Visuals Yurbi prevents decision paralysis by ensuring users can easily select the most suitable visual representation for their data.
User-Centric Customization Customizable features across all visualizations, including titles, legends, label formats, hover boxes, and drill-down capabilities, give users the flexibility to adapt visualizations to their unique requirements.