
Stop rebuilding
your reporting layer.
Your dev team shouldn't be maintaining a BI stack. Embed Yurbi — your customers get self-service analytics under your brand, running inside your own stack — and your engineers go back to your product.
Startup or small software vendor? Ask about startup pricing →
- 20+ chart types — ready to use, no configuration
- Runs in your stack — your AWS, Azure, GCP or on-prem servers
- Flat annual pricing — no per-user or consumption billing
- Connects to SQL Server, PostgreSQL, MySQL, Oracle & more

Four kinds of teams choose Yurbi
Embedded analytics for ISVs shipping to customers, startups launching their first product, teams replacing legacy BI, and enterprises whose data can't touch a vendor's cloud.

ISV & SaaS product teams
Your product generates data your customers want to see. Your dev team is either building reporting from scratch or keeping a fragile home-grown BI layer alive. Yurbi ends that tax — configure once, give customers self-service, get your engineers back. And because it runs in your environment, it adds no outside data processor to your customers' security reviews.
See what Yurbi does Download Free Trial
Startups & small software vendors
Your customers want reports and dashboards, but every engineer hour belongs to your product. Embed Yurbi and launch with self-service analytics built in — no BI sprint, no reporting team. Startup pricing is available; just ask.
See startup options
Teams replacing Crystal, SSRS, or Izenda
Your product already has embedded reporting — but every report change requires a developer, or the vendor was acquired and the roadmap stalled. Yurbi connects to the same databases and gives users self-service.
See all comparisons
Enterprise & security-conscious teams
Your data can't leave your environment and a cloud BI tool isn't an option. Yurbi is fully air-gap capable — no required outbound connections, installs on your own infrastructure, MS SQL backend for high-volume deployments.
See our security modelA finished analytics experience — not a starting point
Your customers don't get a chart widget — they get a complete self-service analytics environment under your brand, isolated to their data, configurable per tenant. See all features →
20+ chart types, ready to use
Bar, line, area, pie, donut, gauge, scatter, map, cross-tab, combo, and more. Every visualization is available out of the box — no chart library to integrate, no custom rendering code.
No-code ad-hoc report builder
Your customers drag fields, pick a chart type, set filters — and build their own reports from the data you've configured. No SQL. No ticket to your dev team. No waiting two sprints for a chart.
Dashboard builder
Customers arrange charts and grids into personal or shared dashboards. Smart Filters slice across all panels simultaneously. FastCache means dashboards load fast even under load.
Schedule & deliver
Automated report delivery on any schedule — daily, weekly, monthly — as PDF or Excel. App Shield ensures each recipient gets only their authorized data, automatically, on every delivery.
Export in any format
PDF, Excel, CSV — customers get their data in the format their workflow needs. Export works on any report or dashboard, with current filters applied.
No developer per request
After your one-time configuration, customers are completely self-sufficient. No more reporting tickets. No more "can you run this for me?" Your dev team is permanently out of the report-writing loop.
AI assistant Coming soon
Plain-language questions and chart suggestions, answered from your semantic layer — so every AI query stays inside each tenant's App Shield policies.
Your best engineers shouldn't be stuck maintaining reports.
It starts as a feature request. It ends with a chunk of your engineering team quietly running a reporting product you never set out to build — a tax you pay every sprint, not a project you finish.
“Can't we just vibe-code it?”
AI coding tools can produce a working dashboard overnight. That's real — and it's where the reporting tax starts, not where it ends.
What AI gets you overnight
- A chart page wired to a few queries
- A demo that looks great on your own data
- More code your team now owns, tests, and supports
What your customers need for years
- Tenant isolation that holds up in a security review
- Self-service report building, so requests stop coming to your devs
- Scheduling, exports, permissions, and white-labeling
- Upkeep as your schema, customers, and versions change
Use AI to build your product faster. Let Yurbi be the reporting layer you never have to maintain. Yurbi vs building it yourself →
Configure once. Ship in weeks.
Yurbi is a configuration project, not a development project. Connect your database, define what customers can see, embed it. Done.
Connect your database
Point Yurbi at your existing database — SQL Server, PostgreSQL, MySQL, Oracle, and more. Read-only connection, no ETL, no data warehouse. Your data stays exactly where it is. See all supported databases →
Configure what customers can see
Map database tables to business-friendly concepts, define joins and calculated fields, set up tenant data isolation. The work that makes self-service possible — done once.
Embed and ship
Integrate Yurbi into your product UI via session token and embed URL. Customers see a branded analytics experience that looks native to your app — and start building reports without asking your team for anything.
Two API calls from sign-in to embedded dashboard.
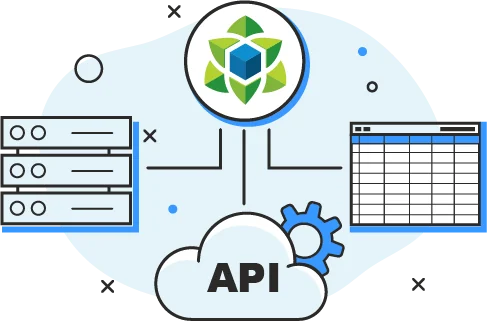
Your backend signs the user in through the DoLogin API and gets a session token scoped to that user's permissions. Your page drops the token into an embed URL. App Shield applies that user's tenant rules to every query, export and scheduled delivery.
- Runs in your stack — your cloud account or on-prem; Docker install is a single command
- No outside data processor in your customers' security reviews — Yurbi lives inside the controls you already have
- Session-token SSO, header-based SSO and two-factor sign-in today; native SAML/OIDC in development
- Honest note: embedding is iframe + REST API today — there's no JavaScript SDK yet
// 1. Your backend signs the user in
POST /api/Login/DoLogin
{ "UserId": "[email protected]",
  "UserPassword": "••••••••" }

// → SessionToken, scoped to Jane's tenant

// 2. Your page embeds a dashboard
<iframe src="https://analytics.yourapp.com/
  embed.html?t=d&i=42&s={SessionToken}">
</iframe>
Built specifically for ISVs — not adapted from enterprise BI

Embedded under your brand — customers never see "Yurbi"
Logo, colors, domain, login page — all yours. Each tenant can have its own branding. Your product, your brand, your URL.
Embedding & white-label →
Multi-tenant security enforced at the query layer
Define App Shield policies once — tenant data isolation runs at query time, not in your app code. Cannot be misconfigured. Cannot be bypassed.
Security model →Published pricing — no sales call to see a number
Flat annual tiers, every feature in every plan, $500 per additional deployment. A user is anyone with a Yurbi login — usually your customers' people, across all tenants — and Unlimited caps the bill at $30K a year. The only embedded analytics platform that's self-hosted, flat-tier, priced per deployment, and fully published — no other vendor stacks all four.
- Every feature in every tier — no paywalls between plans
- A flat annual price that doesn't move at renewal
- Runs on your infrastructure — your data never leaves your servers
- You reach the engineers who built it — not a first-tier support queue
One customer runs Yurbi across 160 deployments — for $76,000 a year.
You don't take that on faith: the pricing is published, the platform is one continuously developed code lineage, and you talk to the engineers who built it.
- 160
- deployments at one ISV customer
- 25+ yrs
- building BI software, since 1999
- Weekly
- releases — not annual roadmaps
- $10K
- published starting price per year
Running Crystal Reports, SSRS, or Izenda?
Crystal and SSRS were built for a pre-SaaS world — every report change still needs a developer. SSRS 2022 is Microsoft's final version. Izenda's feature development slowed after acquisition as its owner's investment shifted to Logi Symphony. Yurbi connects to the same SQL Server databases and gives your users self-service — without rebuilding from scratch.
Your software ships to customer servers. Yurbi scales with that model.
Many ISVs deploy their software directly to each customer's environment — on-premise, customer-managed cloud, or a mix. Yurbi is built for this architecture.
Each deployment runs its own Yurbi instance — isolated, independently branded, no data crossing between customers. With dozens or hundreds of customer deployments, economics stay predictable where consumption-based competitors become impossible to budget.
A vendor you can actually work with
We've watched founders realize their sharpest engineers have quietly become a reporting team — that every sprint spent on dashboards is one the product didn't move forward.
When analytics are embedded in your product, you can't afford a vendor who treats your renewal as a profit center.
Enterprise embedded BI vendors
- Sisense — no public pricing, hidden behind a sales call
- Logi Symphony — assembled from acquired products, with older ones (Izenda, Exago) pushed toward migration
- Tier-1 support — not the engineers who built it
- Power BI Embedded — capacity billing that steps up a SKU as traffic grows
Bootstrapped. One code lineage since 1999.
- Published pricing from $10,000/year — everything included
- 50–80% less than enterprise vendors for same capabilities
- One continuously-developed code lineage since 1999 — no acquisition baggage
- You talk to the engineers who built it — directly
- Predictable flat pricing — no consumption spikes
Common questions about Yurbi
Yurbi is a self-hosted embedded analytics platform for ISVs and SaaS companies. It adds a no-code report builder, 20+ chart types, dashboards, scheduling, and export inside your product — isolated per customer, branded as your product, running on your own servers.
Yurbi is a presentation and query layer — not ETL. It queries your existing application database directly in read-only mode. Nothing is copied or transformed. You configure what customers can see; they explore their data themselves, without ever asking your dev team for a report.
A complete self-service analytics environment: 20+ chart types, a no-code drag-and-drop report builder, dashboards they build and share, automated scheduled delivery (PDF or Excel), and multi-format export. All under your brand, on your domain, isolated to their data.
Customers are self-sufficient. They build reports, explore their data, and schedule delivery without ever asking your team for anything. Your dev team is permanently out of the report-writing loop.
No. Yurbi queries your existing application database directly in read-only mode. No ETL pipeline, no data warehouse, no new infrastructure. You point Yurbi at the database your product already uses, configure the semantic layer (what customers can see and what the fields mean), and you're done. Your data never moves.
Building multi-tenant embedded analytics from scratch means solving data isolation, white-labeling, query performance, a full no-code report builder, 20+ chart types, scheduling, export, and ongoing maintenance — typically consuming 20–30% of engineering sprint capacity indefinitely. That's a permanent reporting tax, not a one-time project.
Yurbi replaces that with a flat annual subscription and a configuration project measured in days. The Build vs. Buy calculator lets you put a real number on it.
Most teams reach production in 4–8 weeks: connect your database (1–2 days), configure the semantic layer (1–5 days), embed and ship (1–3 days). Teams with well-documented schemas and available developer time move faster.
Yurbi's professional services team can run all three steps if you need to move faster. See the full implementation guide →
Yurbi's Tenant Mode enforces data isolation at the platform level. Each tenant is assigned to a security group controlling which database, schema, or filtered view they can access. App Shield injects data-level constraints directly into the SQL query at execution time — on every report, dashboard, scheduled delivery, and export. It cannot be bypassed.
Works with shared databases (row/schema filtering) and per-tenant separate databases via dynamic routing. Full security model →
Nothing changes until you cross your plan's user cap. Flat tiers: Starter ($10K/yr, 75 users), Growth ($18K/yr, 250 users), Scale ($24K/yr, 500 users), Unlimited ($30K/yr). Moving up means paying the difference — no per-user penalty, no consumption billing.
Additional deployments are $500/year at list rate, with volume discounts after your first 10. Full pricing →
Yes. Yurbi is fully air-gap capable with no required outbound connections to 5000fish servers. It installs on your own infrastructure (Windows Server, Linux, or Docker), queries your databases read-only, and never transfers your data externally. Well-suited for healthcare, government, defense, and financial services deployments with strict data residency requirements. Full security model →
They can build a first dashboard quickly — AI coding tools are good at that. The cost was never the first dashboard. It's everything after it: per-customer data isolation, a self-service report builder so customers stop sending report requests, scheduling and export, permissions, white-labeling, and keeping all of it working as your schema and customer list change. AI-generated code is still code your team owns and supports. Yurbi gives your customers self-service from day one, so your developers — and your AI tools — stay focused on your product. Yurbi vs building it yourself →